Introduction
In my career I have worked extensively with financial applications in all fields. Starting from real time trading applications to data mining and analytics and even statistical pattern analysis. Over this period of time I learned a lot of things and have explored both Python and R as options for finance.
Finance is an industry that requires a deep understanding of mathematical and statistical models, and powerful tools to analyze large amounts of data. There are many programming languages that finance professionals can choose from, but two of the most popular ones are Python and R. Both have a large community of users, a wealth of libraries and tools, and job opportunities in the finance industry.
In this article I’m going to try and break down which one is better and why. While I can’t promise that I’m going to cover all use cases I will do a deep dive into the grits of why I consider each language a good candidate for this industry.
Summary Table
If you quickly want to glance and find a specific category to compare the two you can look up at this summary table outlining the differences between Python and R in finance.
| Python | R | |
|---|---|---|
| Ease Of Use | Easy | Average |
| Tools | Excellent | Decent |
| Libraries | Excellent | Good |
| Performance | Average | Good |
| Jobs | Saturated | Low |
| Popularity | Very popular | Almost unknown |
| Future | Good | Good |
For an additional summary I have a quick answer and question section below. If you need to know more take a deeper look at the article sections of interest.
Quick Answers

Before I do the deep dive I want to give you a quick summary of some things I considered are important to note if you don’t have the time to stick with me for this long explanation of the two. The Q&A below will address the answers you are seeking but if you do not see what you want please look further down and I will probably have you covered.
Q. Which one is better for finance, Python or R?
A. Both Python and R are suitable for finance, and the choice between the two will depend on your specific needs and requirements.
Q. Is Python easier to learn than R?
A. Yes, Python is generally considered to be easier to learn and use than R, especially for new and non-technical users.
Q. Are there job opportunities in finance for Python and R professionals?
A. Yes, both Python and R are in high demand in the finance industry, which means that there are plenty of job opportunities for finance professionals who are proficient in either language. However, Python is generally more widely used than R in the finance industry, which may result in more job opportunities for Python professionals.
Q. Which language is faster and more efficient, Python or R?
A. Python is generally considered to be faster and more efficient than R, as it is a compiled language while R is an interpreted language. However, R has several libraries that can be used to improve performance.
The choice between Python or R for finance ultimately comes down to your specific needs, goals, and requirements. Both languages have their own strengths and weaknesses, and the best choice will depend on what you need to accomplish with your financial analysis. It may be beneficial to learn both languages and understand the pros and cons of each, in order to make the best decision for your financial analysis needs. Regardless of which language you choose, having proficiency in either Python or R will be a valuable asset for your career in finance. Stay tuned if you want to learn more as I’m about to break down some details for you.
Python For Finance

Python is a high-level, interpreted programming language that was created in the late 1980s. It is widely used in finance for data analysis, risk management, and algorithmic trading. Python has a large and active community, which has created a wealth of libraries and tools that are specifically designed for finance.
Features of Python for Finance
- Easy to learn: It has a simple and intuitive syntax, which makes it easy to learn for both new and experienced programmers.
- Versatile: It is a general-purpose programming language, which means that it can be used for a wide range of applications, including finance.
- Large community: It has a large and active community of users, which provides support and resources for developers.
- Rich ecosystem: It has a rich ecosystem of libraries and tools that are specifically designed for finance.
Tools and Libraries for Python in Finance

Below I’m going to list tools that I’ve used over the years and I think will be helpful for most financial applications. Keep in mind this may change over time but these I think define the core of it. I’m going to give you a simple example on each case so you can relate to it.
NumPy

NumPy is a library for scientific computing in Python, which includes functions for linear algebra, statistics, and data processing. If you have done anything with computation or finance you’ve probably heard of it. It offers a lot of features that relate to financial applications. Let me demonstrate this in an example below.
import numpy as np

# Calculate the mean return of a stock portfolio
returns = np.array([0.05, 0.06, 0.07, 0.08, 0.09])
mean_return = np.mean(returns)
print("Mean return:", mean_return)

# Calculate the covariance matrix of two stocks
returns1 = np.array([0.05, 0.06, 0.07, 0.08, 0.09])
returns2 = np.array([0.04, 0.05, 0.06, 0.07, 0.08])
covariance = np.cov(returns1, returns2)
print("Covariance matrix:\n", covariance)
In this example, we are using the NumPy library for financial calculations.
The first calculation we perform is to find the mean return of a stock portfolio. We create a NumPy array returns that contains the daily returns of a stock portfolio. Then, we use the np.mean function to calculate the mean return of the portfolio. This gives us a single number that represents the average daily return of the portfolio.
Next, we calculate the covariance matrix of two stocks. We create two NumPy arrays, returns1 and returns2, that contain the daily returns of two different stocks. Then, we use the np.cov function to calculate the covariance matrix of these two stocks. This gives us a 2×2 matrix that represents the covariance between the two stocks.
As you can see this is pretty powerful especially if you are working with spreadsheets and other complex computational data.
Pandas

Pandas is a library for data analysis in Python, which provides data structures for working with structured data, as well as functions for data manipulation and analysis. My favorite thing with Pandas really is that I can load excel and csv files very fast and perform operations into them as matrices. The example below demonstrates this.
import pandas as pd

# Load stock data into a Pandas DataFrame
stock_data = pd.read_csv("stock_data.csv")

# Calculate the average daily return for each stock
average_returns = stock_data.mean()
print("Average returns:\n", average_returns)

# Calculate the correlation between stocks
correlation = stock_data.corr()
print("Correlation matrix:\n", correlation)
First we load the stock data into a Pandas DataFrame. We use the pd.read_csv function to load a CSV file containing the stock data into a DataFrame. This gives us a convenient and flexible structure for working with the stock data.
Next, we calculate the average daily return for each stock. We use the mean method of the DataFrame to calculate the mean return for each stock. This gives us a new DataFrame that contains the average returns for each stock.
Closing we calculate the correlation between stocks. We use the corr method of the DataFrame to calculate the correlation matrix of the stock returns. This gives us a matrix that shows the relationship between the returns of each stock.
Matplotlib

Matplotlib is a library for data visualization in Python, which provides functions for creating plots, histograms, and other visualizations. How can you do finance without being to look at a chart right? Well matplot solves this exact problem. Below we will go over a quick example to basically load some CSV data and display a graph.
import matplotlib.pyplot as plt
import pandas as pd

# Load stock data into a Pandas DataFrame
stock_data = pd.read_csv("stock_data.csv")

# Plot the daily returns of each stock
stock_data.plot(kind='line')
plt.title("Daily Stock Returns")
plt.xlabel("Date")
plt.ylabel("Return")
plt.show()
First we load the stock data into a Pandas DataFrame. We use the pd.read_csv function to load a CSV file containing the stock data into a DataFrame. This gives us a convenient structure for working with the stock data.
Then we plot the daily returns of each stock. We use the plot method of the DataFrame and set the kind argument to 'line' to create a line plot of the stock returns. We also add a title, x-axis label, and y-axis label to the plot to make it more informative. Finally, we use the plt.show function to display the plot.
Python Finance APIs
Python has a great finance application APIs support that you can make use of, below I’m going to describe a few of them that they can help you on your day to day tasks.
TradingView

The first one I want to touch upon is one of everyone’s favorite, trading view. I think it has a plethora of premade charts and those can assist you into making trading decisions. Below I’m going to cover how easy it is to access their API using Python in order to accomplish what you want.
import requests
import json

# TradingView API endpoint for retrieving stock data
url = "https://scanner.tradingview.com/america/scan"

# Set the parameters for the API request
params = {
    "symbols": {
        "ticker": "AAPL",
        "type": "stock"
    },
    "columns": [
        "close",
        "change",
        "volume"
    ]
}

# Make the API request
response = requests.get(url, params=params)

# Extract the JSON data from the response
data = json.loads(response.text)

# Extract the stock data from the JSON data
stock_data = data['data'][0]

# Print the stock data
print("Close:", stock_data['close'])
print("Change:", stock_data['change'])
print("Volume:", stock_data['volume'])
In this code, we use the requests library to make an API request to the TradingView API. The API endpoint for retrieving stock data is stored in the url variable.
We then set the parameters for the API request in the params dictionary. In this example, we are requesting data for the stock with the ticker symbol “AAPL”, and we are requesting the close, change, and volume columns.
Next we make the API request using the requests.get function and pass in the url and params variables. The API response is stored in the response variable.
We then extract the JSON data from the response using the json.loads function and store the result in the data variable. Finally, we extract the stock data from the JSON data and print it to the console.
This code demonstrates how you can use the TradingView API in Python to retrieve stock data and display it in your own applications or scripts.
E-Trade

If you are more about automating trading you can use something like E-trade. Before we focused more on how you can accomplish things in this case we will focus more on how you can execute on things such as trade. This will allow you to perform a fully automated pipeline using entirely Python and accessing external platform APIs.
import requests
import json

# E-Trade API endpoint for retrieving account information
url = "https://etwssandbox.etrade.com/accounts/rest/accountlist"

# Set the headers for the API request
headers = {
    "Authorization": "Bearer <OAuth 2.0 Access Token>",
    "Accept": "application/json"
}

# Make the API request
response = requests.get(url, headers=headers)

# Extract the JSON data from the response
data = json.loads(response.text)

# Extract the account information from the JSON data
account_info = data['Account']

# Print the account information
print("Account ID:", account_info['accountId'])
print("Account Type:", account_info['accountType'])
print("Account Description:", account_info['description'])
In this code, we use the requests library to make an API request to the E-Trade API like we did earlier with TradingView. The API endpoint for retrieving account information is stored in the url variable.
We then set the headers for the API request in the headers dictionary. The Authorization header is set to a valid OAuth 2.0 access token, which is required for authentication. The Accept header is set to application/json to indicate that we want to receive the API response in JSON format.
Next, we make the API request using the requests.get function and pass in the url and headers variables. The API response is stored in the response variable.
Going into JSON data from the response using the json.loads function and store the result in the data variable. Finally, we extract the account information from the JSON data and print it to the console.
This code demonstrates how you can use the E-Trade API in Python to retrieve account information and display it in your own applications or scripts. I do have to note that both of those APIs may change at any time so always do your research to see what attributes may have been altered but the above will give you a good understanding of why I think Python is pretty decent dealing with financial platforms.
R For Finance

R is a programming language and software environment for statistical computing and graphics. It was created in the early 1990s and is widely used in finance for data analysis, modeling, and visualization. R has a large and active community, which has created a wealth of libraries and tools that are specifically designed for finance. Below I’m going to cover some of it’s basic modules to show you how powerful they are when it comes to finance and how they compare to Python.
Quantomod

We will start with the quant mod library which I think is one of the core things you need to use if you are working with stock tickers and want to use them to plot data.
# Load the quantmod library
library(quantmod)

# Get data for a stock symbol
getSymbols("AAPL")

# Plot the adjusted close price for the stock
chartSeries(AAPL[,6], type = "line", theme = "white")
In this code, we use the quantmod library to retrieve data for the stock symbol “AAPL”. We then use the chartSeries function to visualize the adjusted close price for the stock over time. The chartSeries function creates a line plot of the adjusted close price with the default “white” theme. The resulting plot shows the adjusted close price for the Apple stock over time.
quantmod is a powerful library for financial modeling and technical analysis in R, and it provides a wide range of functions for retrieving financial data, creating charts and plots, and performing technical analysis. The chartSeries function is just one of the many useful functions available in the quantmod library for financial data visualization.
As you can see with 3 lines of code we literally did a lot of what Python would need with much more code and complexity. This shows how powerful R is when it comes to working with financial models.
GGPlot2
Next we will be talking about a bit more advanced plotting library that can be used in R for finance. This is very similar to matplotlib in Python but in my opinion simpler and straight forward to use with finance.
# Load the ggplot2 library
library(ggplot2)

# Load the quantmod library
library(quantmod)

# Get data for a stock symbol
getSymbols("AAPL")

# Calculate the daily returns for the stock
returns <- diff(log(AAPL[,4]))

# Create a data frame with the returns
returns_df <- data.frame(returns)

# Plot the daily returns using ggplot2
ggplot(returns_df, aes(x = seq(from = 1, to = length(returns), by = 1), y = returns)) +
  geom_line() +
  xlab("Time") +
  ylab("Daily Return") +
  ggtitle("Daily Returns for Apple Stock (AAPL)")
In this code, we use the ggplot2 and quantmod libraries to retrieve data for the stock symbol “AAPL” and calculate its daily returns. We then create a data frame with the returns and use ggplot2 to visualize the data. The ggplot function creates a new plot, and the aes argument defines the mapping between the variables in the data frame and the aesthetics of the plot. In this case, we map the time to the x-axis and the daily returns to the y-axis. The geom_line function creates a line plot, and the xlab, ylab, and ggtitle functions add labels to the x-axis, y-axis, and plot title, respectively. The resulting plot shows the daily returns for the Apple stock over time.
We basically extended our first example and added to it to make it much better by creating a plot for the stock ticker of Apple.
XTS
The next library I want to demonstrate to you is XTS. I think it has a place with R and finance and it’s comparable to numpy to some extent. In the example below we will see it do some wild math functions with no effort.
# Load the xts library
library(xts)

# Load the quantmod library
library(quantmod)

# Get data for a stock symbol
getSymbols("AAPL")

# Convert the data to an xts object
aapl_xts <- as.xts(AAPL)

# Calculate the daily returns for the stock
returns_xts <- diff(log(aapl_xts[,4]))

# Plot the daily returns using xts
plot.xts(returns_xts, type = "l", xlab = "Time", ylab = "Daily Return")
In this code, we use the xts and quantmod libraries to retrieve data for the stock symbol “AAPL” and convert it to an xts object. We then calculate the daily returns for the stock using the diff function and the log of the closing prices. Finally, we use the plot.xts function to visualize the daily returns over time. The plot.xts function is specifically designed for plotting time-series data stored in xts objects, and it creates a line plot of the daily returns with the x-axis labeled as “Time” and the y-axis labeled as “Daily Return”. The resulting plot shows the daily returns for the Apple stock over time.
Features Of R In Finance
- Strong statistical capabilities: It is a language that is specifically designed for statistical computing and analysis, which makes it well-suited for finance.
- Large community: It has a large and active community of users, which provides support and resources for developers.
- Rich ecosystem: It has a rich ecosystem of libraries and tools that are specifically designed for finance.
Comparison of Python and R for Finance
So, which one is better for finance, Python or R? The answer is not a straightforward one, as both Python and R have their strengths and weaknesses when it comes to finance. Let’s take a closer look at the comparison between Python and R for finance.
Ease of Use

Python is generally considered to be easier to learn and use than R, especially for new and non-technical users. Python has a simple and intuitive syntax, which makes it easy to read and write code. On the other hand, R has a more complex syntax, which can make it challenging for new users. However, once you are familiar with R, it can be more powerful and flexible than Python for certain types of financial analysis.
Python is often favored by data scientists and engineers who are already familiar with the language, as it has a relatively simple syntax and is easy to learn. Python is also widely used in industry, so there are many resources available for learning and troubleshooting. On the other hand, R is specifically designed for statistical analysis and is therefore favored by statisticians and data analysts. R has a large number of libraries and functions specifically designed for financial analysis and visualization, such as quantmod and ggplot2 as we demonstrated earlier.
Tools and Libraries

Both Python and R have a rich ecosystem of libraries and tools that are specifically designed for finance. Python has libraries such as NumPy, Pandas, and Matplotlib, which are widely used for finance applications. R has libraries such as quantmod, ggplot2, and xts, which are also widely used for finance applications. In my opinion here I think Python has a slight advantage as it provides libraries that you can interact with besides the standard finance ones.
Performance

When it comes to performance, both Python and R have their own advantages and disadvantages.
Python is known for its average performance when it handles large amounts of data. Python has been optimized for numerical and scientific computing and has a large number of libraries for high-performance computing, such as numpy and pandas, which are specifically designed for fast data analysis. These libraries are optimized for memory efficiency and parallel processing, allowing Python to perform ok even on large datasets. Additionally, Python has a number of tools and libraries for optimizing performance, such as Cython and Numexpr, which can significantly speed up certain tasks. If you throw in some concurrency with multiprocessing it can do fairly well.
On the other hand, R is often criticized for its slow performance, especially when dealing with large datasets. R’s strengths lie in its statistical and data visualization capabilities, rather than its performance. However, there are a number of libraries and packages available for improving R’s performance, such as data.table and dplyr. These packages are designed to improve the speed and memory efficiency of data analysis tasks in R. Additionally, R has a number of packages specifically designed for high-performance financial analysis, such as xts and quantmod, which are optimized for fast data analysis and manipulation.
The performance of Python or R will largely depend on the specific tasks you are trying to perform and the tools and libraries you are using. If you are dealing with large datasets and need fast performance, then Python may be the better choice. However, if you are primarily interested in statistical analysis and data visualization, then R may be the better choice for you.
Job Opportunities

Both Python and R are highly valued by employers. However, the demand for each language may vary depending on the specific job role and industry.
Python is widely used in the financial industry for tasks such as data analysis, risk management, and algorithmic trading. Python’s popularity has grown rapidly in recent years, and it is now considered one of the most popular programming languages for financial data analysis. This has led to a high demand for professionals with Python skills in the finance industry, and many financial institutions now use Python as their primary programming language for data analysis and other finance-related tasks.
R, on the other hand, is known for its strong statistical capabilities and is widely used in the finance industry for tasks such as statistical modeling, data visualization, and portfolio analysis. R has been used in finance for many years, and it is well established in the industry as a powerful tool for financial data analysis. As a result, there is a strong demand for professionals with R skills in the finance industry, particularly for roles that require expertise in statistical analysis and data visualization.
Python and R are highly valued in the finance industry and there are job opportunities for professionals with skills in either language. The specific language you choose will depend on your interests, skills, and the type of finance role you are interested in pursuing. It’s also worth noting that many financial institutions use both Python and R, so having proficiency in both languages may increase your job prospects in the finance industry.
Future and Popularity
Before I close I want to leave you with a chart showing the popularity of the two languages when it comes to finance. Offcourse Python is much more popular here so it’s a bit of an unfair comparison to R. The reason I’m including it here though is to show you the power of having a big community with a lot of answers when you search for something.
Since Python is much more popular it will have a bigger impact on accomplishing things faster and finding what you need. On the other hand I found the R community to be smaller but not to be underestimated in any way as it still offers a very good and solid source of information.
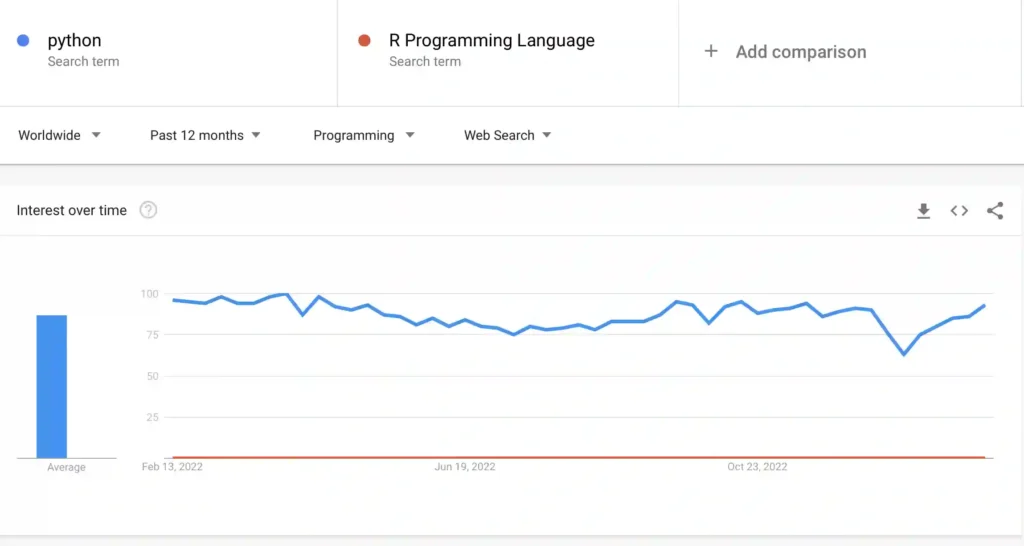
As verified this is just for the last 12 months as R is a relatively new language. There are no signs of R surpassing Python in any way shape or form so for now you Python enthusiasts you have a victory.
Conclusion
I think Python and R are suitable for finance, and the choice between the two will depend on your specific needs and requirements. My choice goes to Python for more complicated finance tasks and R for simpler tasks. The reason is that I think Python has a larger set of external libraries that can also help with non finance tasks whereas R is more specialized on finance for this. R has a strong focus on statistical analysis and is more powerful and flexible than Python for certain types of financial analysis. The information I gave in this article however should help you on a baseline decision with which language to go with, in any case good luck on your finance projects!