
Introduction
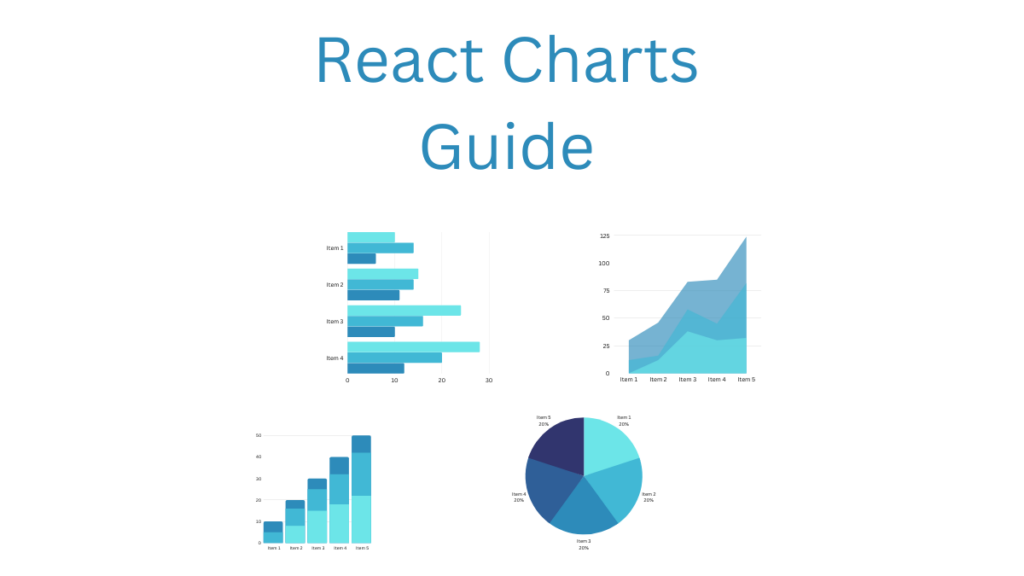
We will cover a Recharts Complete Guide With Examples.
Did you know that recharts is an out-of-the-box React library?
We will break down this in the following sections:
- Why you should consider using recharts as a library
- How to setup your environment and get started
- Some practical examples with code for creating charts
I have used these methods successfully in various projects, and they work very well saving me a ton of trouble and time debugging things when creating charts for my graphical web apps.
We will go point by point on getting you up and running in less than 5mins; having some background programming knowledge in Javascript and React is helpful if you want to fine-tune our code, but you don’t need it to start creating new graphs.
This complete guide should cover all your questions on using React to create charts.
All code and examples of how to do this can be found in the Github link.
Which Graph Library To Use In React
Javascript is a very popular programming language so there’s a lot of libraries that you can use with it. Since React is a framework built around Javascript naturally all the graphing/chart libraries will also work with it. However there’s a catch and easy so below I’m going to outline some reasons as to why you may want to consider using Recharts if you are working on a React application.
- Recharts is designed for react, meaning it offers out of the box react components which you can just plug in your react code directly.
- You avoid writing any boiler plate code to initialize the library and convert the chart code into React components.
- It’s native with React so you will not have any versioning issues as it uses the latest library components.
- It supports a lot of chart types which will surely cover all your needs.
- Customization is done with React styling which enables you to fine tune the look of your charts in the React way.
- It’s already implemented for you so you can focus on the creative part of things such as the design and styling.
I believe the list above is compelling enough on why someone would consider using the Recharts library in his project, I certainly do mostly because I like that someone else has taken care for me of the boiler plate code.
How To Setup Recharts
In this section I’m going to cover how to setup Recharts on your system using the Yarn package manager. I personally have long switched over to the new implementation of yarn (2) which allows me to basically get rid of the old node_modules directory which was annoying. I like the parallelism and speed Yarn2 offers so this part of the setup is using this approach. If you want to follow the npm or older yarn version approach I recommend you check the official guides which are referenced at the links section below.
How to use Create React App using Yarn 2
The first thing we need to do is build a react application that has all of our dependencies. Since Yarn 2 doesn’t offer this by default up to this date what we will do is using Yarn version 1 and then convert our project to the latest using the set version command. This can be seen below.
$ yarn create react-app react-chart-guide
yarn create v1.22.19
[1/4] 🔍  Resolving packages...
[2/4] 🚚  Fetching packages...
[3/4] 🔗  Linking dependencies...
....
Happy hacking!
✨  Done in 25.77s.

$ yarn set version latest
yarn set version latest
➤ YN0000: Retrieving https://repo.yarnpkg.com/3.2.3/packages/yarnpkg-cli/bin/yarn.js
➤ YN0000: Saving the new release in .yarn/releases/yarn-3.2.3.cjs
➤ YN0000: Done in 0s 274ms

$ yarn
➤ YN0070: Migrating from Yarn 1; automatically enabling the compatibility node-modules linker 👍
➤ YN0000: ┌ Resolution step
➤ YN0000: └ Completed in 8s 953ms
➤ YN0000: ┌ Fetch step
➤ YN0000: ┌ Link step
➤ YN0000: └ Completed in 6s 285ms
➤ YN0000: Done with warnings in 48s 170ms

$ rm -rf node_modules
Lets go over and see what we did above step by step:
- First we create the sample react app to get going using Yarn Version 1 this initializes everything include node_modules but don’t worry we will get rid of that soon
- The next step is that we change the version of Yarn from 1 to the latest
- Once this completes we now need to run a migration of our project from version 1 to the latest using the yarn command
- Finally we can get rid of node_modules
You are all set now you should have a sample React app all set using the latest version of Yarn!
How To Install Dependencies
Now that our version of React is all setup we need to go ahead and install the Recharts library. In order to do this we simple need to add it in our package json file and start using it.
$ yarn add recharts
➤ YN0000: ┌ Resolution step
➤ YN0000: └ Completed in 3s 248ms
➤ YN0000: ┌ Fetch step
➤ YN0000: └ Completed in 1s 403ms
➤ YN0000: ┌ Link step
➤ YN0000: └ Completed in 0s 372ms
➤ YN0000: Done with warnings in 5s 151ms

$ grep recharts package.json
    "recharts": "^2.1.14",
The first command we run is basically adding the Recharts package in our project. This downloads and fetches any dependencies it has and installs them in our system. Finally to verify we grep our package json file to ensure it got added successfully but also to find out what version it installed. In our case we will be using Recharts version 2.1.14. I expect things to be backwards compatible across versions but if you have any problems following this guide just ensure you have the same version installed and you should be all set.
How To Test If React Setup Is Working
As a final step we want to ensure our React has been setup properly and it’s working. To do this we simply need to invoke our React server using the start command. Note this was created automatically for us in our package json file under the scripts category.
"scripts": {
    "start": "react-scripts start",
    "build": "react-scripts build",
    "test": "react-scripts test",
    "eject": "react-scripts eject"
}
If we take a closer look at it we will see that it’s using React Scripts to invoke it. Essentially it’s an abstraction layer to have some handy commands such as starting, stopping and testing your React application.
Lets go ahead and invoke this and see what happens:
$ yarn start

Compiled successfully!

You can now view react-chart-guide in the browser.

  Local:            http://localhost:3000
  On Your Network:  http://192.168.11.13:3000

Note that the development build is not optimized.
To create a production build, use yarn build.

webpack compiled successfully
This basically started our server successfully and also loaded in our default web browser. If this worked you should see a window that looks like this:

The next step is to start creating some charts now that our environment is all setup.
How To Make Pie Chart In React
The first chart we will be creating is a pie chart which is very popular and I always end up seeing one in the web UI projects I’ve worked on in the past. To do this we will be leveraging the recharts code alongside in all of the components below. Everything will be implemented as a re-useable functional component since it’s the modern way of doing things in React. If you want you can still use the old style class based components that extends ReactComponent but I will be focusing on the newer approach here.
So lets go over the code that implements a Pie chart.
import { PieChart, Pie } from 'recharts';

const innerdata = [
  { name: 'C1', value: 100 },
  { name: 'C2', value: 20 },
  { name: 'C3', value: 300 },
  { name: 'C4', value: 90 },
];

const outerdata = [
  { name: 'P1', value: 10 },
  { name: 'P2', value: 100 },
  { name: 'P3', value: 20 },
  { name: 'P4', value: 30 },
  { name: 'P5', value: 90 }
];


export default function UbPieChart(props) {
  return (
      <div>
        <PieChart width={400} height={400}>
          <Pie data={innerdata} dataKey="value" outerRadius={50} fill="teal"/>
          <Pie data={outerdata} dataKey="value" innerRadius={80} outerRadius={90} fill="blue"/>
        </PieChart>
      </div>
  );
}
We will go ahead and analyze the code above:
- First we define a default function component that we expose that will return our Chart. It’s very important here to make it start with a capital letter otherwise React will not render it. Furthermore you need to also accept the props argument.
- This component uses the PieChart component that recharts gives us so we initialize it on a 400×400
- Next we make 2 charts an inner and outer chart. Both of those have different radius and coloring as showing above (teal/blue)
- The values they are initialized with are shown earlier and this is just to give it some points on splitting up the pie chart
- Finally we return the generate JSX code we implemented so it can be re-used.
If we view the web browser in localhost as we demonstrated earlier we will see the following pie chart being rendered into the screen.
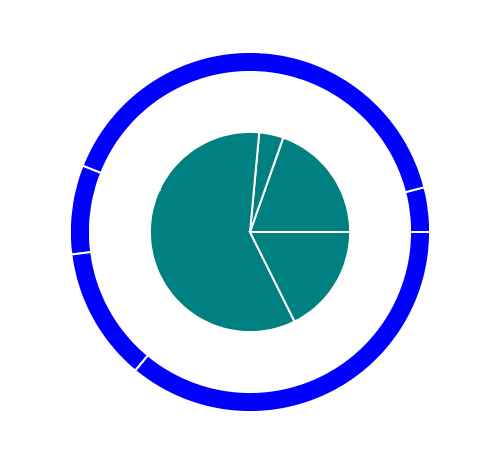
This confirms that we have successfully been able to create a pie chart in React using recharts.
How To Make A Line Chart In React
The next chart we will be creating in a line chart. This type of chart is very popular so I figured I will include an example here for you to view. The code that implements this component can be shown below.
import { LineChart, Line, XAxis, YAxis, CartesianGrid, Tooltip, Legend } from 'recharts';

const data = [
  {
    name: 'A',
    c1: 3000,
    c2: 2400,
    c2: 1400,
  },
  {
    name: 'B',
    c1: 2000,
    c2: 1000,
    c3: 2210,
  },
  {
    name: 'C',
    c1: 1400,
    c2: 10100,
    c3: 1290,
  },
  {
    name: 'D',
    c1: 3120,
    c2: 4400,
    c3: 1000,
  }
];
export default function UbLineChart() {
    return (
        <div>
            <LineChart
                width={500} height={300}
                data={data}
                margin={{
                    top: 5,
                    right: 30,
                    left: 20,
                    bottom: 5,
                }}>
                <CartesianGrid strokeDasharray="3 3" />
                <XAxis dataKey="name" />
                <YAxis />
                <Tooltip />
                <Legend />
                <Line type="monotone" dataKey="c1" stroke="red" activeDot={{ r: 12 }} />
                <Line type="monotone" dataKey="c2" stroke="green" />
            </LineChart>
        </div>
    );
}
- First we define a default function component that we expose that will return our Line chart. As before you need to make it start with an upper case letter and pass in props.
- This component uses the LineChart component that recharts gives us so we initialize it on a 500×300
- Next we define two Lines with a legend and a grid using (red/green) coloring
- The values they are initialized with are shown earlier to create the line charts as shown below
- Finally we return the generate JSX code we implemented so it can be re-used.
Similar as before if we render the page we will see the lines below which is what we were expecting from our values.
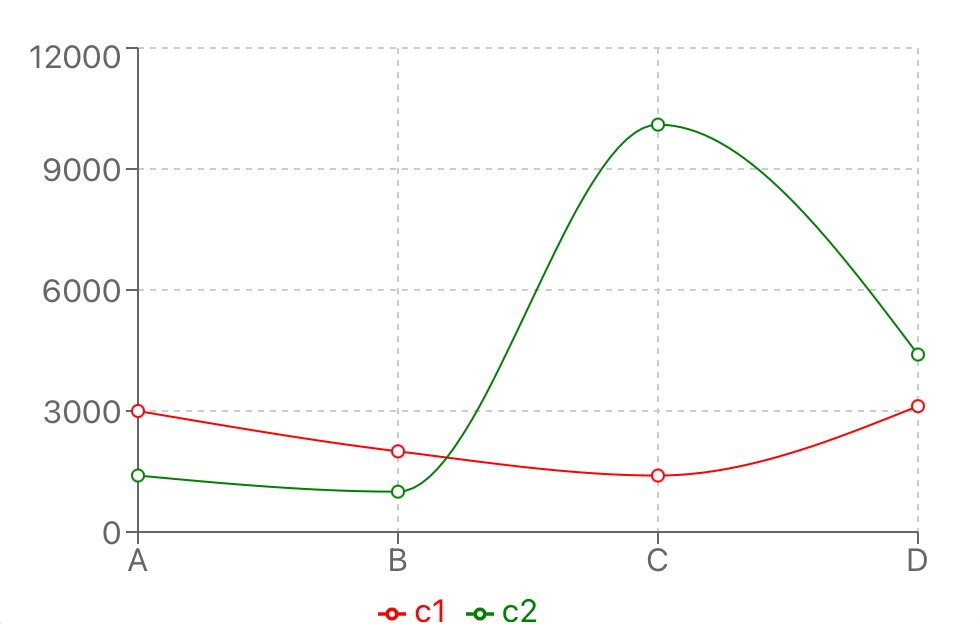
We successfully demonstrated how to create a line chart in React using the recharts library.
How To Make A Scatter Chart In React
The next chart I would demonstrate is a scatter chart. Similar to the ones earlier the code is done using a functional component, lets check the code and see how this one works.
import { ScatterChart, Scatter, XAxis, YAxis, CartesianGrid, Tooltip } from 'recharts';

const data = [
  { x: 90, y: 120, z: 100 },
  { x: 11, y: 10, z: 220 },
  { x: 30, y: 40, z: 40 },
  { x: 110, y: 150, z: 210 },
  { x: 30, y: 200, z: 310 },
  { x: 80, y: 10, z: 110 },
];

export default function UbScatterChart() {
    return (
      <div>
        <ScatterChart
          width={300}
          height={300}
          margin={{
            top: 20,
            right: 20,
            bottom: 20,
            left: 20,
          }}
        >
          <CartesianGrid />
          <XAxis type="number" dataKey="x" name="upper" unit="px" />
          <YAxis type="number" dataKey="y" name="lower" unit="in" />
          <Tooltip cursor={{ strokeDasharray: '3 3' }} />
          <Scatter name="Grid" data={data} fill="blue" />
        </ScatterChart>
      </div>
    );
}
- First we define a default function component that we expose that will return our Scatter Chart.
- This component uses the ScatterChart component that recharts gives us so we initialize it on a 300×300
- Next we define two axis one measured in pixels and the other one in inches.
- We add a grid that’s of blue color here as you can see the dots below.
- The data we feed in the grid with has an x,y and z coordinate the latter not being very important here in visualization.
- Finally we return the generate JSX code we implemented so it can be re-used.
If we render the code above we will be seeing the following chart:
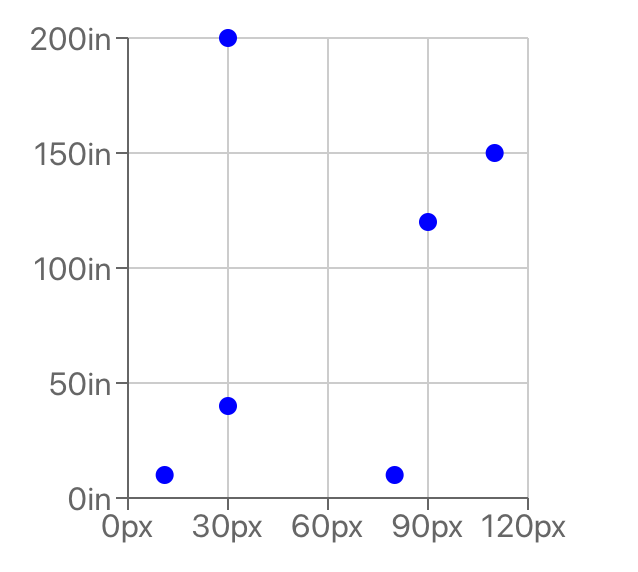
This successfully demonstrates how to create a Scatter chart in React.
Putting It All Together
Finally we need to demonstrate the code that puts all of our components together and renders everything in one page.
import UbScatterChart from './UbScatterChart';
import UbLineChart from './UbLineChart';
import UbPieChart from './UbPieChart';

function App() {
  return (
    <div>
      <UbScatterChart/>
      <UbPieChart/>
      <UbLineChart/>
    </div>
  );
}

export default App;
- The first thing we do is import our React components (can be found in the Github referenced in the bottom of the page)
- The function simply returns the functional JSX components we just created here.
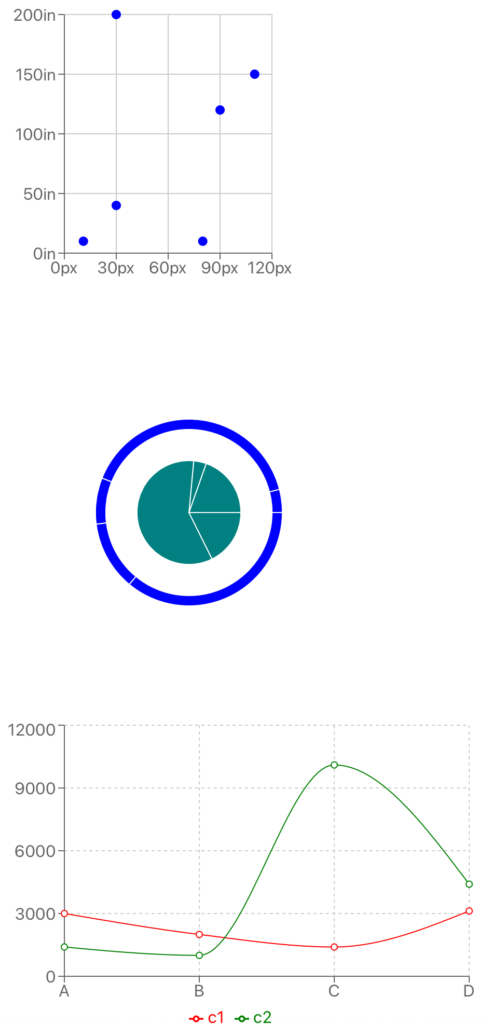
If we render the visualization we can see below all 3 charts in 1 page separated by div’s.
Conclusion
We were able to go over this Recharts Complete Guide With Examples in an easy to explain manner with examples. Hopefully, I answered any questions you may have and helped you get started on your quest to creating charts in React.
Please drop me a cheer below if you found this helpful and think it may have helped you. I would appreciate it.
If you have any questions or comments, please post them below or send me a note on my Twitter. I check periodically and try to answer them in the priority they come in. Also, if you have any corrections, please let me know, and I’ll update the article with new updates or mistakes I made.
What’s your favorite type of chart to use in your Web apps?
Having the power to create charts leverages your capabilities in a graphical web environment. The ability of having an out of the box library that works natively with React components is a major plus. I personally prefer to avoid implementing boiler plate code to use other libraries if someone has made React components for me as they are easily pluggable anywhere in my React projects.
If you would like to find more articles related to Javascript you can check the links below:
You can find information about relevant projects referenced in this article in the list below: